Become a Patron!
When It Comes to
Preventing the School-to-Prison Pipeline,
Ohio Schools are Failing!
Some Ohio schools suspend students as early as pre-school, and unfortunately, suspensions are being handed out in a racially biased way. Further, schools send students home for non-violent and subjective offenses. Suspended students are more likely to be dismissed from school. [1] Students who are suspended an/or dismissed from school are at an increased risk of incarceration later in life.[2] This phenomenon is called the School-to-Prison Pipeline.
The Ohio Department of Education produces an annual report card on racial disparities in Ohio schools, evaluating various criteria, but school discipline is not one of the areas evaluated.[3] A school discipline report card is necessary because parents need to be informed about this performance factor when choosing a school for their child. Also, policymakers need access to this information so that they can make changes in the operation and practices of their schools. This report is intended to fill in that missing information for parents and policymakers.
“Blacks who dropout have a 70% chance of going to prison. Students who have one suspension in 9th grade are only half as likely to graduate. The school-to-prison pipeline has been clearly demonstrated.”
Professor Emerita Vernellia Randall,
The University of Dayton School of Law
The Ohio School discipline report card evaluates three components: exclusions, subjective behavior, and racial disparity.
- Exclusions: Exclusion is the combined rate of out of school suspensions, expulsions, emergency removal by a hearing officer and removal by district/school personnel. There is also a penalty for any exclusions in pre-kindergarten through 3rd grade and excessive exclusions in the 9th grade.
- Subjective behavior: When a student is disciplined, the behavior prompting the discipline can be either objective (i.e., excessive tardiness) or subjective (i.e., insubordination). Exclusion for subjective behavior is problematic because subjective standards are more likely to be influenced by explicit and implicit biases.[4] We calculated the subjective behavior grade based on the percentage of exclusions that was for disruptive/disobedient behavior, harassment/intimidation, and unwelcome sexual conduct.
- Racial disparity: Racial disparity evaluates the difference in exclusion based on race. In this report, it is measured by dividing the rate of the racial group with the highest exclusions by the rate of the racial group with the lowest exclusions.
The school discipline report card will educate the community, provide information as to how a school district/school is performing on the school to prison pipeline, and allow the community to compare one school against others on this critical performance metric. The Ohio school discipline report card evaluates 1173 different school entities. The 2019 Ohio School Discipline report is based on data reported to the Ohio Department of Education. The discipline and enrollment data is for 2017 - 2018 and is the most recent data available as of February 1, 2019.
Organizational Type
Information about Organizational type came from the Ohio Educational Directory System (OEDS). This report includes information on 1173. Schools. Of those 1173, 52.2% (612) are public districts and 29.7% (348) are Community (Charter) Schools.
Typology of Ohio Public Districts
In 1996, ODE created a classification system making it easier to compare similar districts referred to as the typology of Ohio school districts.[5] In 2007, the typology was revised to take advantage of the 2000 census data. With the availability of more recent data from the 2010 census ODE again revised the typology for 2013. [6] ODE has not revised the typology since 2013. [7] Consequently, its accuracy is highly suspect. However, the typology provides valuable information. Of the 1173 districts, 607 (51.7%) had a typology. Of those 607, 209 (37.8%) were rural; 200 (33%) were small town; 123 (20.3%) were Suburban and 53 (9.0%) were Urban.
Ohio School Student Enrollment
The reported school enrollment for the state of Ohio for 2017- 2018 for the 1054 districts/schools in this report was 1722300. Two school districts did not report their enrollment ( Foxfire Intermediate School and Pleasant Community Digital). Kelleys Island Local (n=5) had the lowest enrollment and the Columbus City School district/school (N=50050) the largest. The Mean (Average) enrollment was 1634. Most (90.5%) students were enrolled in Public district/school with 6.4% being enrolled in Community (Chart) Schools. In Public Districts, Type 2: Rural had the lowest mean student enrollment (937) and Type 8 Urban districts had the highest mean (24373).
Final Grade Distribution
The final grade was calculated as follow:
|
Exclusions |
40% |
Exclusion is the combined rate of out of school suspensions, expulsions, emergency removal by a hearing officer and removal by District/School personnel. There is also a penalty for any exclusions in pre-kindergarten through 3rd grade and excessive exclusions in the 9th grade. |
|
Subjective Behavior |
25% |
Subjective Behavior Grade Schools received a grade if they had a large portion of exclusions for inappropriate discipline and non-violent behavior that is subject to individual comfort level and biases. The subjective behavior grade was based on the percentage of exclusions that was for disruptive/disobedient behavior, harassment/intimidation, and unwelcome sexual conduct. |
|
Racial Disparity |
35% |
Racial disparity is the difference in exclusion based on race. In this report, it is measured by dividing the rate of the racial group with the highest exclusions by the average rate of the other racial groups |
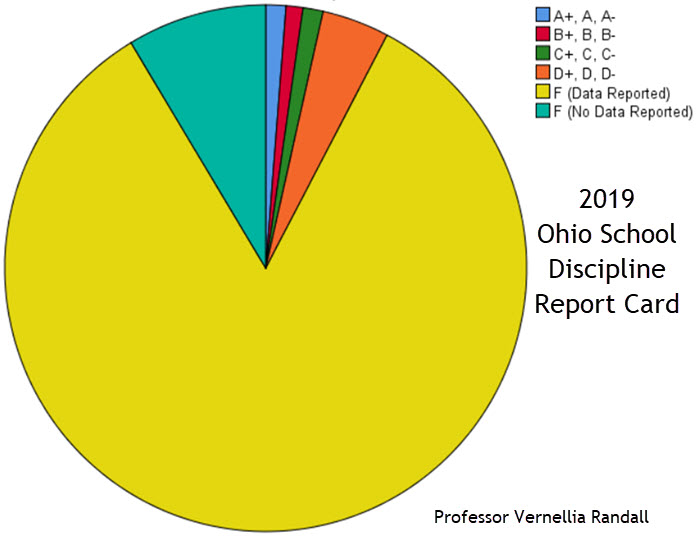
Final Letter Grade
There were 1173 districts/schools in this analysis. Of 1173, 212 (18.1%) received no grade because they appeared to be districts not required to report or they reported data through another encompassing District/School. A total of 961 districts received a grade. Three (.3%) received an A+ for scoring a 100 on exclusion, subjective behavior, and racial disparity. Those districts were: Ottoville Local, Pettisville and Russia Local. All three of these districts were public districts, and all were Type 2 Rural districts. 887 (75.6%) received an "F." Of those districts, 83 (7.1%) were schools/districts that were required to report information and did not.
|
2019 Ohio School Discipline Final Letter Grade - Grouped |
|||
|
|
Frequency |
Percent |
Valid Percent |
|
A+, A, A- |
12 |
1.0 |
1.2 |
|
B+, B, B- |
10 |
0.9 |
1.0 |
|
C+, C, C- |
12 |
1.0 |
1.2 |
|
D+, D, D- |
40 |
3.4 |
4.2 |
|
F (Data Reported) |
804 |
68.5 |
83.7 |
|
F (No Data Reported) |
83 |
7.1 |
8.6 |
|
Total |
961 |
81.9 |
100.0 |
|
Missing |
212 |
18.1 |
|
|
1173 |
100.0 |
||
Final Numerical Grade
A total of 878 districts/schools(74.9%) received a numerical grade. Schools did not receive a numerical grade if they did not report either exclusion data or enrollment data. Some schools reported both exclusion data and enrollment data as "<10". For those schools, they were assigned "3" for exclusions and "5" as enrollment. The average Final numerical grade was 38.3; Half the schools/districts had a grade below 37.3. The lowest Final Grade was -14.4, and the highest was 100. Public Districts had a higher mean final grade (42.0) than Community (Charter) Schools (30.1). This difference was statistically significant (p=.000). That is, there is zero probability that this difference occurred by chance. Urban schools had the lowest mean Final Numerical Grade(16.6), and Suburban schools had the highest mean Final Numerical Grade (54.2). This difference was statistically significant (p=.000). That is, there is zero probability that this difference occurred by chance.
Subcategory Grade Distribution
Exclusion Grade
Exclusion is the combined rate of out of school suspensions, expulsions, emergency removal by a hearing officer and removal by District/School personnel. There is also a penalty for any exclusions in pre-kindergarten through 3rd grade and excessive exclusions in the 9th grade. Of the 879 reporting districts, the half had more than 94 exclusions, with the average being 348 total exclusions. Some districts had 0 exclusions; while one district had 23,988 exclusions. The total number of exclusions for the state of Ohio was 242,388. That is in Ohio, during 2017-2018, over 240,000 expulsions, out-of-school suspensions and removals occurred.
Of the 1173 districts, only Community (Chart) Schools and Public school districts reported discipline occurrences. Half the reporting schools had rates equal to or below 7.3 exclusions per 100 students. While the average was 17.7 exclusions per 100 students; the lowest reported was 0 exclusions per 100 students, and the highest was 188.6 exclusions per 100 students. That is 188.6 combined expulsion, out-of-school suspension, and removals per 100 students.
The average Final Exclusion grade was 37.0; Half the schools/districts had a grade below 38. The lowest Final Exclusion Grade was -44.7, and the highest was 100. Public Districts had a higher mean grade (46.7) than Community (Charter) Schools (15.4). This difference was statistically significant (p=.000). Urban schools had the lowest mean (-11.1) Exclusion - Final Grade; and Suburban schools had the highest mean Exclusion - Final Grade (68.7). This difference was statistically significant (p=.000).
Three districts had a rate of zero exclusions per 100 students (Ottoville Local, Pettisville Local, Russia Local). Forty-one (41 schools and districts had a rate of less than one exclusion per 100 student. One hundred and forty- seven districts had a negative overall exclusion grade. Of the 22 worst districts, 16 (72.7%) were community (charter schools). All of the Public Districts were urban districts (Type 7 or Type 8)
To see the specifics of how this grade was constructed, click on this link.
Subjective Behavior Grade
Schools received a grade if they had a large portion of exclusions for inappropriate discipline and non-violent behavior that is subject to individual comfort level and biases. The subjective behavior grade was based on the percentage of exclusions that was for disruptive/disobedient behavior, harassment/intimidation, and unwelcome sexual conduct.
Of the 880 districts that reported the rationale for exclusions, half the schools had more than 55.6% of their exclusions based on explanations defined by this report as subjective behavior. The average was 54.9% of exclusions based on subjective behavior; the lowest was 0, and the highest was 100%. The mean for Community (charter) schools (57%) was higher than the mean for Public Districts (54%). This difference was statistically significant (p=.02). Which means that there is less than a 2% chance of this difference occurring by chance alone. There was a difference based on the typology of public districts. Urban schools had a higher percentage of their exclusions based on subjective behavior (61.7%) than suburban districts (50.3%). This difference was statistically significant (p=.00). Which means that there zero chance of this difference occurring by chance alone.
Of the 880 districts that reported Initial Subject Behavior Discipline grade, the median grade was 39.8. The average was 41.0; the lowest was 0, and the highest was 100. The mean for Community (charter) schools (40.0) was lower than the mean for Public Districts (41.0). This difference was not statistically significant (p=.275); That is there is a 27.5% chance that the difference occurred by chance alone. Type 8 Urban districts had a lower mean grade (28.0) and Type 6 suburban districts (49.1) had the highest mean grade(49.1). This difference was statistically significant (p=.000)
Seventeen schools (1.9%) made a grade of 100. Nine of the schools (52%) that earned 100 were community (charter) schools. All of the eight public districts that earned a grade of 100 were either rural or small-town schools. Twenty schools (2.3%) made a grade of zero or less. This means that for these schools, all of their disciplinary actions were for subjective reasons. Thirteen of the schools (65%) that earned zero or less were community (charter) schools. Of the seven public districts, all were either rural or urban schools. Two schools (Alternative Education Academy and Toledo City) made grades less than 0.
To see the specifics of how this grade was constructed, click on this link.
Racial Disparity Grade
The racial disparity grade is based on a determination of how much racial difference there is in the exclusion of students from schools/districts. Exclusion includes discipline occurrences of Expulsion, out-of-school suspension, Emergency removal by district personnel, and Removal by hearing officer.
A rate per 100 students was calculated for each of the seven racial groups recognized by the State of Ohio: American Indian or Alaskan Native, Asian, Black, Hispanic, Multiracial, Pacific Islander and white. The average "highest exclusion rate" for the state was 51 exclusions per 100 students. Then for each school, the racial group with the highest exclusion rate was identified: Black Students had the highest exclusion rate in 354 of the school/districts (40.3%).
A racial disparity ratio was calculated; that is comparing the racial group with the highest exclusion rate to the average exclusion rate for the other racial groups in a particular school. The mean racial disparity ratio was 15.6; that is in the state of Ohio, on average school/districts were 15 times more likely to exclude students from one racial group than the average exclusion from other groups at the school.
Three schools earned a grade of 100 because they did not have any racial disparity in their exclusion rates. While another 4.7% earned between 90 to 95 for having a racial disparity ratio less than or equal to 1.44. On the other hand, 20 of the districts (2.3%) earned a "0" for having racial disparity ratio greater than or equal to 99.45. Most schools (600 or 68.3%) earned a grade of 40 for racial disparity ratio between 1.45 to 9.44. Community (Charter) Schools had a higher mean grade (40.11) than Public District (36.98). This difference was statistically significant (p=.005)
The racial disparity grade was assigned grades based on the following value - any significant racial disparity is failing. In the context of this report card, any racial disparity ratio greater than 1.44 is failing. However, to recognize the significant difference between 1.45 racial disparity ratio and 99.45 racial disparity ratio, failing grades were assigned from 0 to 40. A racial disparity ratio of 1.45 means that the racial group with the highest exclusion rate was 1.45 times more likely to be excluded than other racial groups in the particular school. While a racial disparity ratio of 99.45 means that the racial group with the highest exclusion rate was 99.45 times more likely to be excluded than the other racial groups in the particular school or district.
The average Racial Disparity grade was 37.9; Half the schools/districts had a grade below 40. The lowest Racial Disparity Grade was 0, and the highest was 100. Community (Charter) Schools had a higher mean grade (40.1) than Public District/School (37). That difference was statistically significant (p=.005). That is, there was less than a .5% probability that the difference occurred by chance alone. Type 3 Small Town districts earned the lowest mean grade (34.6) while Type 6 Suburban districts earned the highest mean grade (41.4). However, the difference in racial disparity grade was not statistically significant. (p=.215).
To see the specifics of how this grade was constructed, click on this link.